Monday, September 19, 2011

Exploring the website - ShakeNZ

When you go to the GeoNet homepage you will see a map of NZ covered in small squares, this is 'ShakeNZ'.  Each one of the squares gets near real-time shaking (this means in a few minutes, not right away) from our instruments out in the field.   So within a few minutes of an earthquake, you can look at the map and get a rough idea of where it was and the intensity of the shaking.

The key thing here is actually to do with the key!   The pic on the right is the key for the map, which shows intensity, not magnitude!   So when there is an earthquake and you can see an area of coloured squares, they are showing the intensity of shaking not the size.

The numbers correspond to the Modified Mercalli Intensity Scale, this is a really handy way to describe the effects of an earthquake, and is generally better than using the magnitude alone (as a mag 4 quake at 5km depth will produce a higher shaking intensity than a mag 4 at 10km depth)  It goes from MM 1 (barely felt by a few people) to MM 12 (complete devastation).

<---  This is what the map looks like with no activity, small blue/purple squares (blank = no data)


This is the map after a mag 5.5 earthquake, 30km deep near Wellington. -->


Now occasionally when we have technical issues ( the instrument is having a bad day, or a tech is out fixing something)  there will be a 'rogue' square!  Its usually pretty easy to see that its an error and not a large earthquake as there is just one square showing a high intensity, and when there is an actual event multiple squares will be 'lit up' .  
The map on the left shows one station/square showing an orange square, or 7 intensity of shaking, if this was an actual event the squares close by would also show some level of intensity.  There are more examples here.


You can also use an interactive version here  and go from 60min to the present - a cool way at looking at the squares light up following an earthquake.   


Friday, September 2, 2011

Felt Reports: Then & Now


GeoNet collects earthquake data directly from the public via our website where people can answer questions about what they felt during an earthquake. We use this feedback to assist with mapping the distribution of shaking intensity of earthquakes(see here ) and with scenario planning for future earthquakes.

These days its a quick questionarre on our website, however, back in the early 1900s (pre-internet -shock horror) things were slightly different! There was no GeoNet and no network of instruments across New Zealand.

For many years dedicated volunteers completed reports, filling in paper questionnaires and sending them to the observatory in Wellington.  Pre-1930s these, along with newspaper clippings, were used by scientists to calculate where an earthquake was located.  This was difficult in NZ as most people lived by the coast, so not much was known about the effects of earthquakes further inland.
Christchurch 1921

We keep all of these old records here at GeoNet
and they can be quite amusing to read, i have scanned 3 examples of 'felt reports' and one old Press article for you to look at here -->


Christchurch 1921
So next time you feel an earthquake and are (very paitently of course) awaiting the details from GeoNet, think back to the earlier years - they never got to find out how big the earthquakes were! 

Palmerston North 1923


Sunday, August 28, 2011

Out in the field - Canterbury : Day 3


 Day 3 - Lara and i packed up and headed back up to the hills above Akaroa, where we put out one more test site.

And then drove back to Christchurch


With a quick photo-stop at McQueens Valley, home to our popular MQZ.


The last stop was up Richmond Hill at Sumner, it was the first time i had been there since the Sept 4th quake, and wow what a difference.  The roads were definitely 'munted' (a popular post-quake phrase) and it was surreal driving around the coast and seeing the wall of containers, to protect from the rockfalls, and the houses perched precariously on the edge of the cliff.


There were still Port-a-loos on every street, and very damaged houses, on the drive up the hill.  


Our temporary site is right at the top, on a new subdivision , we changed over the batteries and then it was back to Wellington.  The site has amazing views, i wonder if people will still buy there?


From up high, things almost looked 'normal'.


Nb: i didn't make Lara do all of the hard work, i did manage to make it into one photo ; )


Friday, August 26, 2011

Out in the field - Canterbury : Day 2


 Another beautiful day, our first two stops were temporary sites, where we changed over the batteries and retrieved the data cards.

Both sites are on farm land and we are always grateful to the owners for allowing us access to their property, and to leave our instruments there for months at a time.some farmers are fantastic and even give us a hand, the pics right and below show the fantastic views from one such farm, where the kind owner helped us get our heavy batteries up and down the hill on his quad-bike.


We then went out searching for ideal test sites for permanent seismic stations. After the scientists have located ideal areas on maps, we then have to go out to the areas to see exactly how 'ideal' they are! As we need to find areas with low noise (cars, wind etc.) good base rock and relatively easy access for the techs to build them.  Once we find suitable areas we then have to track down the landowners and ask for their permission.  Luckily this was relatively easy today and they were fantastic, and happy for us to 'play' on their land.


Step 1 - Dig a hole for the vault


Step 2 - Concrete a paving slab to the rock below "to essentially bond the sensor to the rock" to make sure you are recording the actual earths movement, as opposed to the movement of the loose earth around it.


 Step 3 - Put the seismometer into the 'vault' - it has to be perfectly level and point north to allow us to derive direction to the seismic waves/earth movement.   A lid is then placed on top and the earth filled back into the hole.


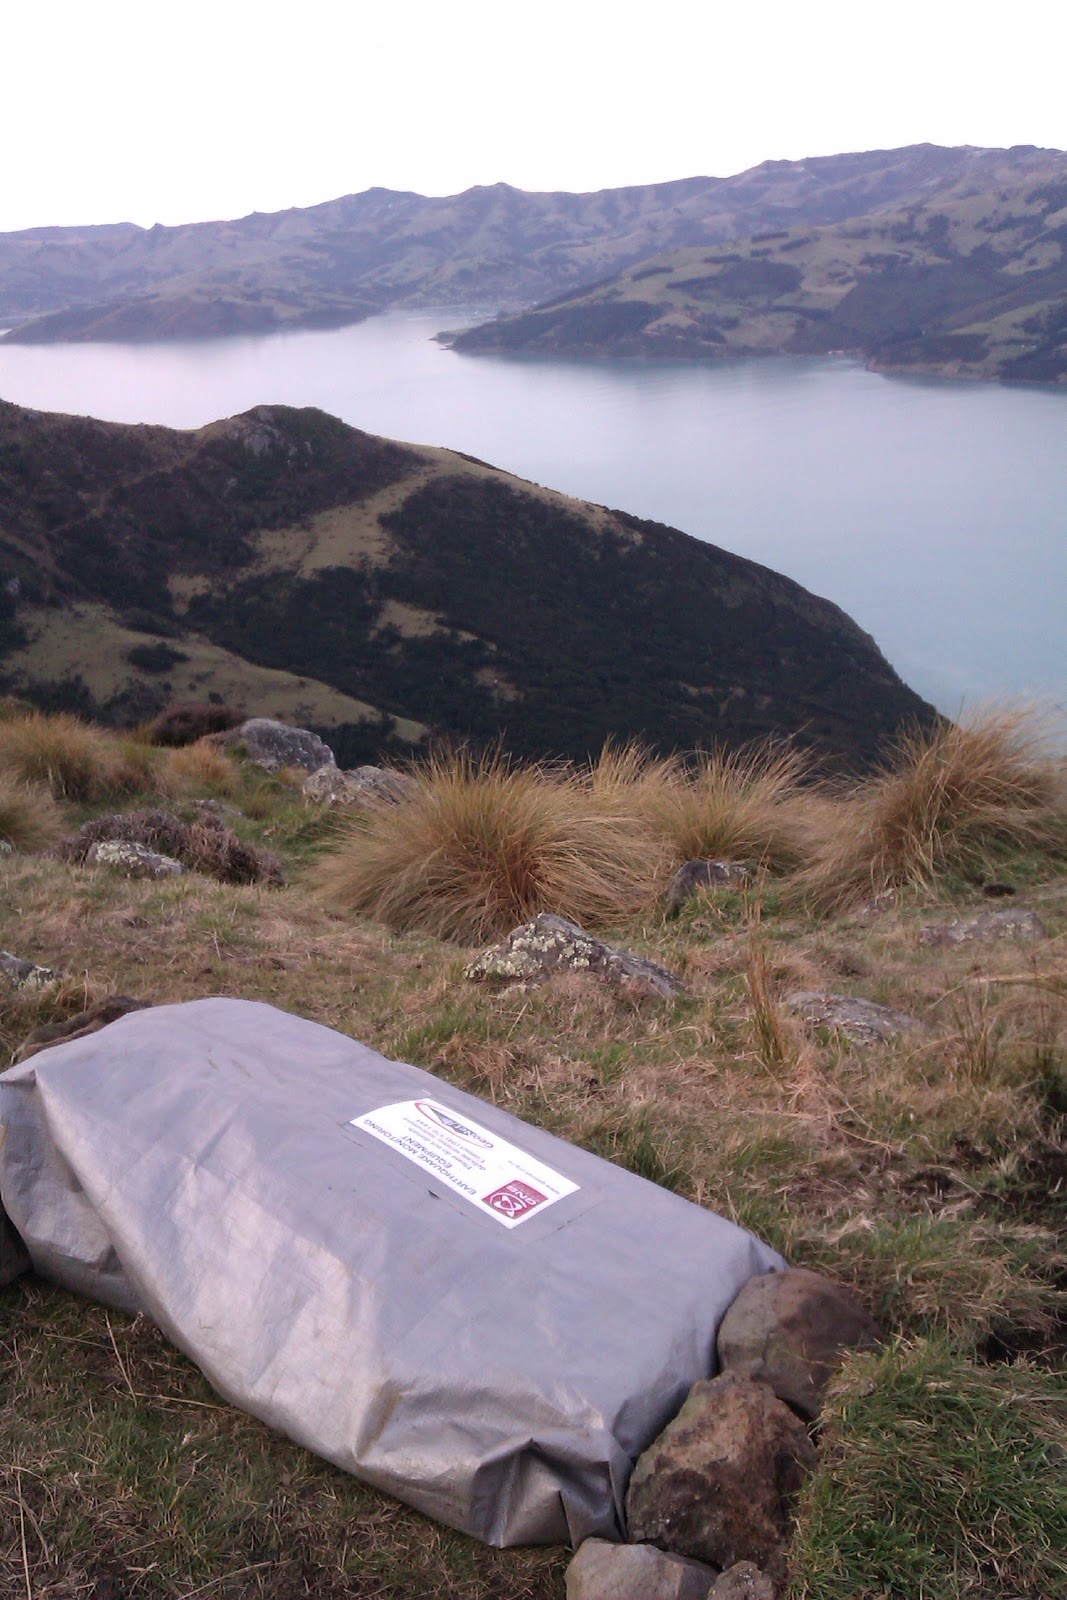
 Step 4 - Connect the seismometer to the Taurus (data logger) and battery (power), and package up all nicely into a tarp to protect from the weather.


Voila!

Tuesday, August 23, 2011

Out in the field - Canterbury

Today i flew down to Christchurch with one of our Operations Scientists at GeoNet (and acting Network Development Manager) Lara. Our task is to replace batteries from our temporary seismic sites around Christchurch, take down some test sites, and scope around for new test areas for permanent sites.

It was a beautiful sunny day, with the odd patch of snow around, left over from last weeks storm!  After getting our hire 4WD, we met up with a ChCh based GNS technician who loaded us up with batteries, we then went to our storage lockup and grabbed some more gear (shovels, concrete etc.) and we were off to our first site.  

Loading up!
The Christchurch GeoNet temp. storage unit.


Berry Farm


 The first site we visited was not far from the airport, and in a farm, so easy access. It is a temporary seismic instrument put out following the Canterbury earthquakes. Technicians have to come out every few months to change the data cards, and replace the batteries.


Summit road - lots of snow left


We then drove to Akaroa via Summit Road, and to the test sites. These are sites carefully chosen by scientists (with maps) to increase our coverage of the Canterbury region  (along with NZ as a whole). Technicians then go out in the field (I'll go into this more tomorrow) and install the test sites for a few months, and these are then recovered and the data studied to see how the readings are (eg if its too noisy)
All that is left is a rebar pole and a few rocks painted bright
pink for the boys (so they can find the correct area) to go out and install the 'proper' site later on!    
Dismantling the first site


I
I think the boys should be able to find this!


The sun was setting, and the cows were coming in for a look.


 The recent snow, and its melting had made the paddocks pretty muddy so we had to lug all of the equipment back to the ute via foot, the batteries weigh 24kg - so this was a good work up for dinner!    The last site we went to, the road was actually blocked by about a foot of snow, so we had to scale fences as well (i'm a shocker at this!) as carry the gear accross the farms.


The last site, racing against the setting sun.


Beautiful view
We finally got to Akaroa at 7, after a quick dinner and shuffle of the batteries in the ute, its off to bed all ready for another big day back out in the beautiful Akaroa hills.   


Friday, July 29, 2011

GeoNet - A Quick Tour

Ever wondered what it looks like here at GeoNet, well wonder no more ....

Thursday, July 28, 2011

Exploring the website - Landslides.

Landslides are a common hazard in NZ, GeoNet has a rapid response capability (a team of experts ready to go to a large/damaging landslide) and is compiling a database of New Zealand's landslides.


We also monitor some large slow moving landslides in New Zealand, we have information on these landslides (http://www.geonet.org.nz/landslide/)  as well as interactive graphs which you can use to see the various GPS, borehole and rain-gauge sites.

To the right is a graph of the Utiku landslide, showing a period of high rainfall in Sept (C) leading to an increase in groundwater level (B) and subsequent ground displacement (A)


You can also read reports from our rapid response team here.